The City of Oakland is in the midst of a heated debate about its Encampment Management Policy—the foundational law passed in 2020 that determines how the city manages homeless encampments. A new proposal by District 7 Councilmember Ken Houston would overhaul the current policy, making it easier for the city to crack down on encampments without notice or shelter offers.
As the debate about Houston’s proposed changes makes its way through the city council and the court of public opinion, we wanted to use data to take a look at the impacts of the city’s current Encampment Management Policy (EMP).
The EMP is a set of policies and laws that are implemented by Oakland’s designated Encampment Management Team (EMT), a multi-departmental body responsible for coordinating encampment interventions and resource provision, overseen by Oakland’s City Administrator.
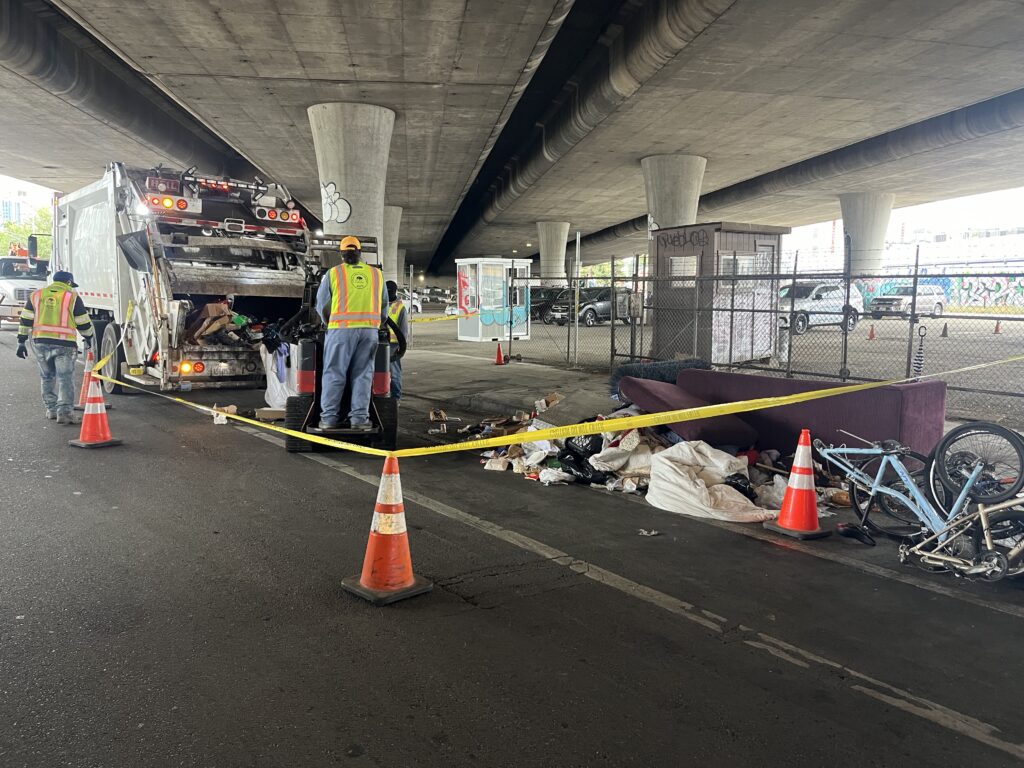
The city’s current policy says the EMT is required to give at least three-day’s notice before performing any type of encampment intervention, including a closure. Notices are typically posted on bright pink slips of paper at the designated encampment site, and contain information about when the EMT operation will start and what it plans to do. As a digital counterpart to those slips, the EMT maintains a public database that catalogues all notices posted on city property. This database, called “Completed Encampment Management Team Operations Since 2021,” is published online by the City of Oakland on its open data portal.
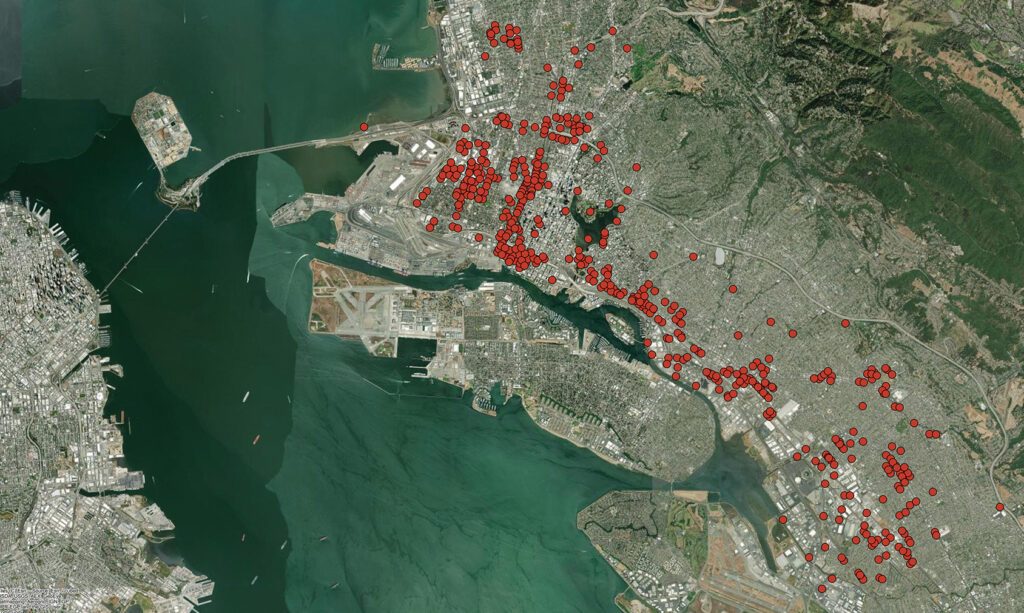
Using this dataset, we made a series of maps and visualizations of the city’s interactions with homeless encampments over the past four years, according to their own data. The resulting analysis is the first chapter in an ongoing project called “Swept Off The Map,” a six-month research project we are developing in collaboration with Street Spirit, and as beneficiaries of UC Berkeley’s Judith Lee Stronach Prize. The goal of our project is to document the scope and scale of encampment sweeps in Oakland, Berkeley, and Richmond, and how constant displacement impacts the people who experience these operations.
In the first phase of our research, we cleaned, geocoded, and analyzed available city data to visualize EMT operations as a series of maps and graphs. Both the map and the code will soon be available to the public, so anyone can download, explore, or build on the work. At press time, the City of Oakland had not responded to multiple interview requests about our analysis of their data.
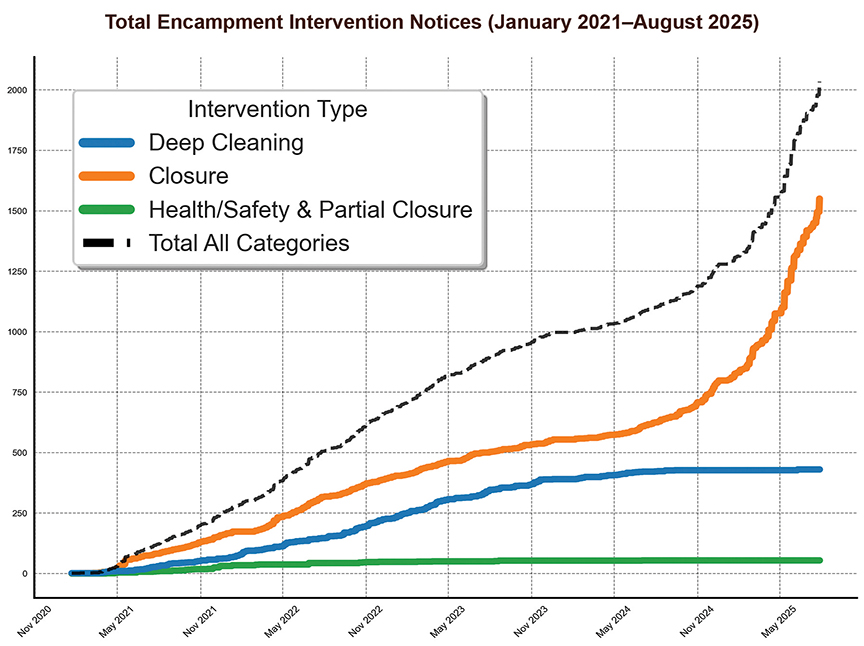
On the whole, the data shows a clear upward trend in encampment closure postings over a four-year period, especially over the past year. For example, in July of 2024 the city’s data shows that there were a total of 21 encampment intervention postings. But in July of this year—the most recent month for which data is currently available—the city’s data shows 131 postings.
It’s not just the number of postings that is changing. According to the city’s data, this spike in postings also corresponds with a strategic shift toward more permanent interventions. There are three main types of interventions captured in this dataset: “Deep Cleanings,” where residents are required to move temporarily while the city cleans the area; “Partial Closures,” where just one part of an encampment is permanently closed but residents can largely remain; and “Full Closures,” where the entire encampment is permanently closed and re-encampment is prohibited.
A fourth intervention type—“Health & Hygiene,” which focuses on routine hygiene services and trash collection at an encampment—is rarely listed on EMT postings, and therefore not analyzed in this dataset.
For the last year, the City of Oakland has largely relied on Full Closures, with only two Deep Cleanings recorded and no Partial Closures recorded during that period.
These on-the-ground changes also correspond with a large-scale political shift. In June of 2024, the U.S. Supreme Court’s ruling in City of Grants Pass v. Johnson said that cities can fine or arrest homeless people for sleeping outside, even if no adequate shelter is available. The following month, Gavin Newsom encouraged local governments to crack down on homeless encampments at the risk of losing state funding. Soon after Newsom’s statement, former Oakland Mayor Sheng Thao issued an executive order that expanded the city’s authority to carry out “emergency sweeps” with shorter notice requirements and no guaranteed shelter options. Councilmember Houston’s new policy proposal would institutionalize Thao’s order, and allow the city to arrest individuals who decline shelter offers.
Though the future of Oakland’s Encampment Management Policy remains uncertain, mapping the city’s encampment operations since 2021 shows that its strategy for managing unsheltered homelessness is already changing. Along with the changes in the frequency and intensity of encampment interventions, the data suggests that the city has concentrated enforcement in certain council districts, repeatedly closed a handful of the same, long-standing communities, and over the last 12 months, adopted a management strategy that reaches farther both geographically and temporally. You will find our analysis of these trends on the following two pages.
Though there is much to learn from this research, it’s important to note that this dataset has significant limitations as a comprehensive record of how often unhoused people are relocated in Oakland. It records only planned interventions during weekday working hours, with no confirmation of whether or not they actually happened, or further explanation of what took place. Furthermore, the city has no standardized way of describing the posting locations. Our attempts to map the data relied on our best efforts to clean and standardize the postings. The dataset also excludes actions such as emergency sweeps with no posted notice, enforcement of re-encampment, and sweeps conducted by other agencies such as Caltrans or the Port of Oakland. It does not capture what happened to residents before, during, or after an intervention.
Mapping encampment interventions by district
Total Encampment Intervention Notices Per District (Jan 2021–Aug 2025)
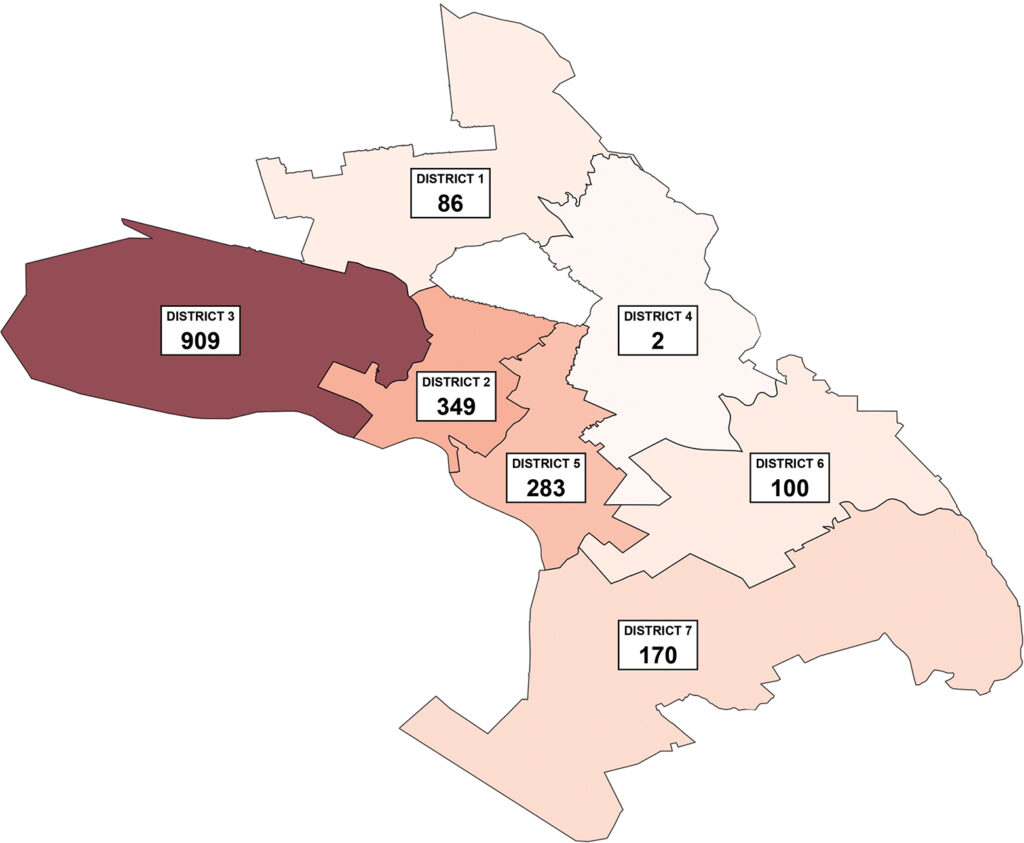
This map shows the number of posted encampment interventions by Oakland City Council District over the past four years. District 3, which includes West Oakland, Jack London, Downtown, and Adams Point, has experienced the greatest number of interventions by far, at 909 over the past four years. Meanwhile, other districts have seen very few encampment interventions. District 4—which includes the neighborhoods of Laurel, Dimond, Allendale, Glenview, Montclair, Redwood Heights, and North Hills—has only recorded two interventions over the entire four-year period.
The uneven distribution of intervention postings also corresponds with long-standing displacement in the City of Oakland. This is especially clear in District 3, where many of the city’s debates about affordable housing are most visible. The historically Black neighborhoods of West Oakland, for example, have seen some of the city’s most rapid gentrification over the past two decades. Downtown Oakland, the city’s commercial core, has seen higher housing costs and dense commercial development, subsequently changing the demographics of the area.
District 3 is also where the majority of Oakland’s resources for encampment residents are located including hygiene stations, community cabins, and other city-funded shelter programs.
The district also contains the majority of the city’s encampments. Using encampment service requests from Oakland’s 311 reporting system between 2021 and 2023, city staff generated an estimate of the number of encampments by council district: District 3 has 29 percent of the city’s encampments; District 2 has 23 percent; District 7 has 15 percent; District 5 has 15 percent; District 1 has 12 percent; District 6 has 11 percent; and District 4 has 5 percent.
Encampments closed again and again: Eight locations with the most interventions over the past four years
Number of Notices Linked to Major Encampments (Jan 2021–Aug 2025)
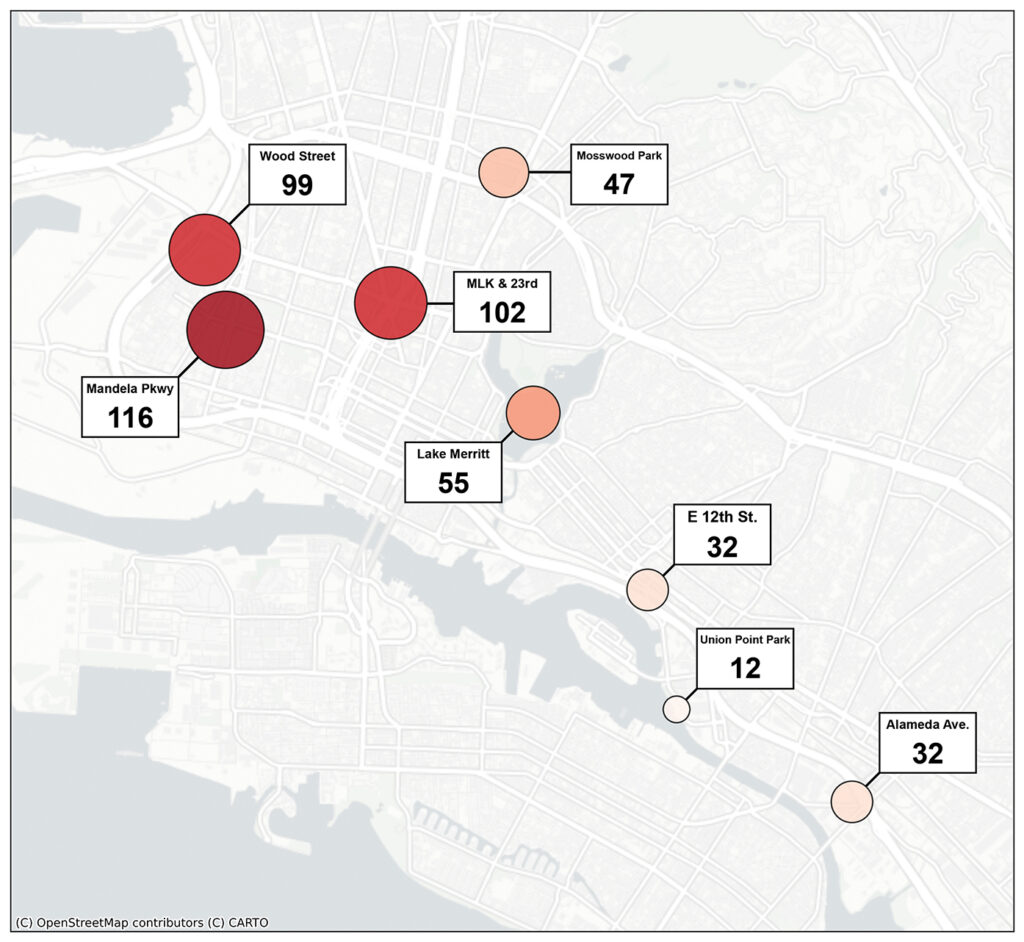
As of August 5, 2025, the city’s four-year data set included 1,899 encampment intervention postings. At least 495 of those postings represent instances where city workers returned to notice the same eight areas. The dataset includes 498 unique encampment locations, demonstrating that on average, each location is swept almost four times.
Several of these locations have been central hubs of encampment life in Oakland for more than a decade. In some cases, they have become semi-permanent communities, with infrastructure people have built up over time (tiny homes, generators, kitchens, gardens, art spaces). Other sites have not developed the similar community infrastructure but have consistently hosted those who need a temporary stop for the night, or a place to gather after being displaced from nearby areas.
All of these encampments fall within “high-sensitivity areas” according to Oakland’s current Encampment Management Policy, which includes parks, major roadways, and residential or commercial corridors. The policy states that these places are prioritized for Full Closure to “prioritize maintaining the areas free of encampments.”
According to the 2024 Point-in-Time Count, Oakland has 5,485 people experiencing homelessness on any given night, with 67 percent living unsheltered. By contrast, the city maintains about 1,300 shelter beds across 24 different program sites. The repeated closure of encampments in these eight locations points to the large gap between the number of individuals in need of shelter and the amount of shelter available.
Case study: An up-close look at the repeated closure of the MLK and 23rd Street encampment
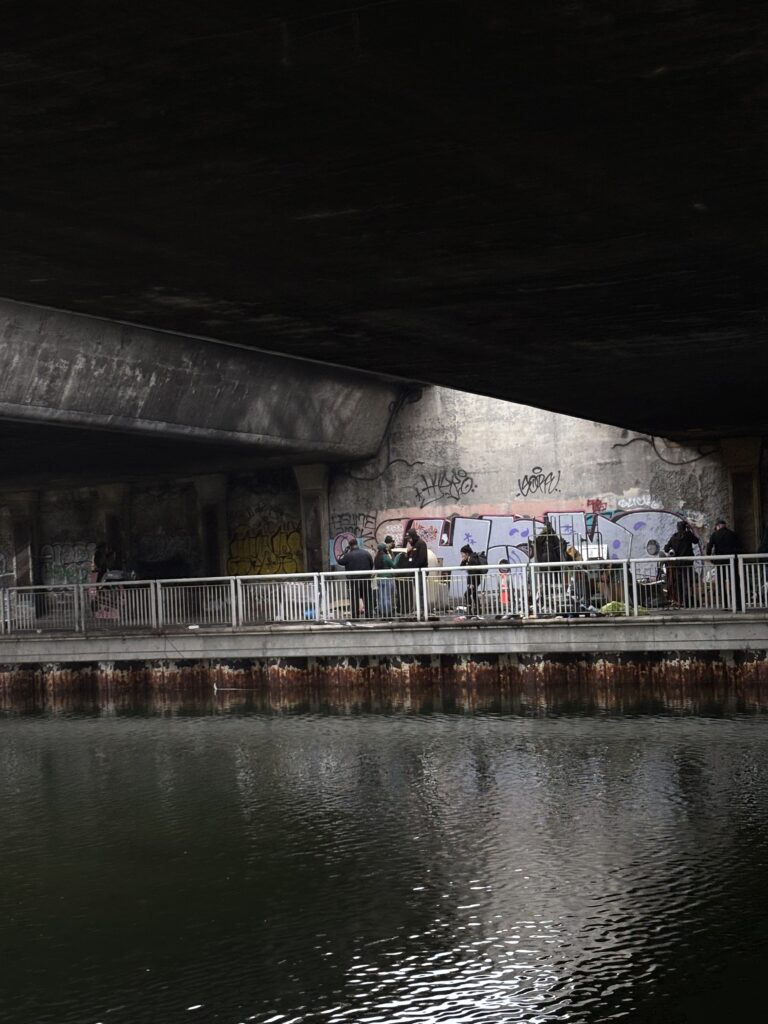
The encampment surrounding the intersection of Martin Luther King Jr. Way and 23rd Street has long been one of Oakland’s most visible—and frequently closed—encampment sites. Situated near downtown and major transit corridors, it has become home to many people over the years, with tents, vehicles, and makeshift structures spanning several blocks in all directions. According to city data, the encampment has been the subject of nearly one hundred interventions since 2021, ranging from Health & Hygiene cleanings to Full Closures.
Most recently, the city enacted a large-scale encampment closure at this site in September 2024. In a public statement, the city cited “aggravated assaults, burglaries, robberies, shootings, and a double homicide at the encampment” as justification for the sweep. But advocates voiced concern that removing people without stable alternatives only displaced them deeper into surrounding neighborhoods.
“We have watched sweep after sweep happen for the past eight years, and watched countless lives be impacted so negatively,” Freeway, an advocate for the unhoused, explained in an interview with CBS. “[It impacts] your health, both mental and physical, and we’ve lost a lot of friends that way.”
Estimates of the community’s population have fluctuated over time. Advocates counted more than 100 residents in lead-up to the September 2024 closure, while the city reported closer to 40. After the encampment closure last September, 16 residents entered the city’s community cabin program, nine were placed in an Alameda County-run medical respite program, and the rest were left without clear shelter options, according to the city.
MLK encampment residents were intended to be beneficiaries of a $7.2 million grant from the state’s Encampment Resolution Fund, which the city used to open the Mandela House shelter, a 105-unit program with supportive services. However, Mandela House did not open until April 2025—over six months after the sweep took place. By then, many former residents had scattered to new or existing encampments.
A new strategy: Closure notices cover greater geographic and temporal dimensions
The spike of Oakland’s encampment intervention postings does not just indicate an increase in the total number of encampment closures. When mapped, it becomes clear that the rise in postings also corresponds to a strategic shift: The city seems to be covering a broader spatial area with intervention postings, and a longer duration of the encampment closure timeline itself.
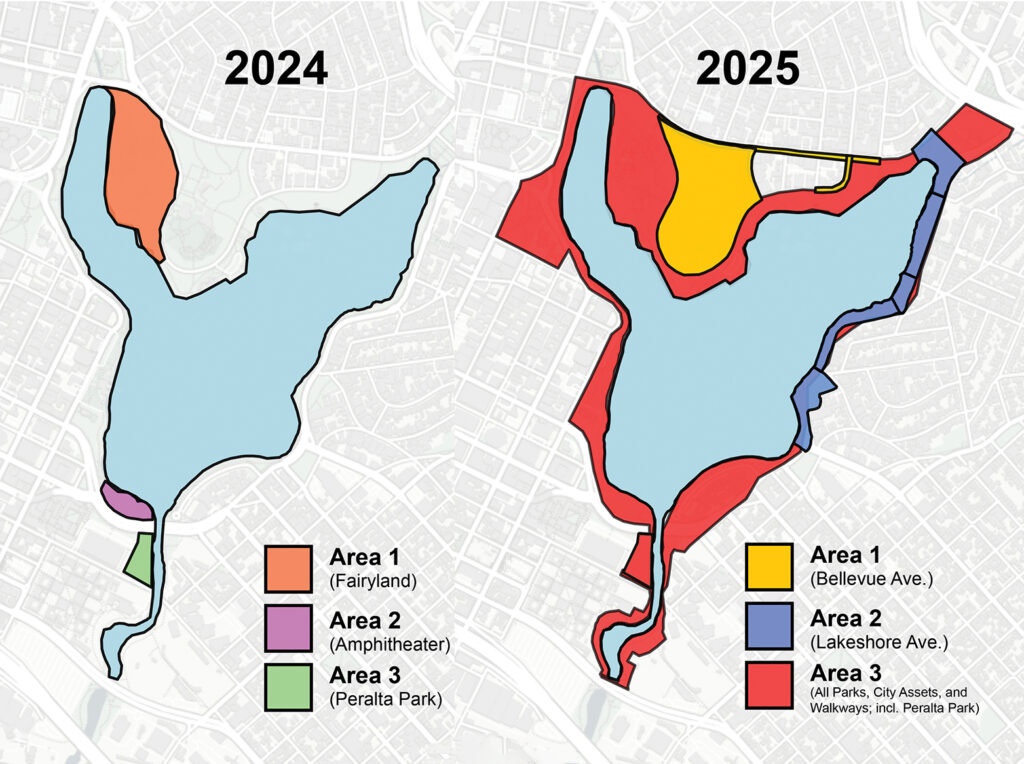
Take Lake Merritt, for example. Visible to commuters, surrounded by parks and businesses, and central to Oakland’s civic life, Lake Merritt has been a target of at least 55 encampment closures over the studied period.
In 2019, Oakland enacted a zero-tolerance camping ban around the lake. The interventions that followed ranged from Deep Cleanings to Partial Closures.
However, starting in April 2025, the city seemed to change its strategy. Instead of one-off cleanings around small portions of the lake, city workers began posting entire stretches of the lakefront with Full Closure notices. They also started scheduling encampment interventions that lasted multiple weeks at a time. Most recently, operations were scheduled for the entire month of April 2025.
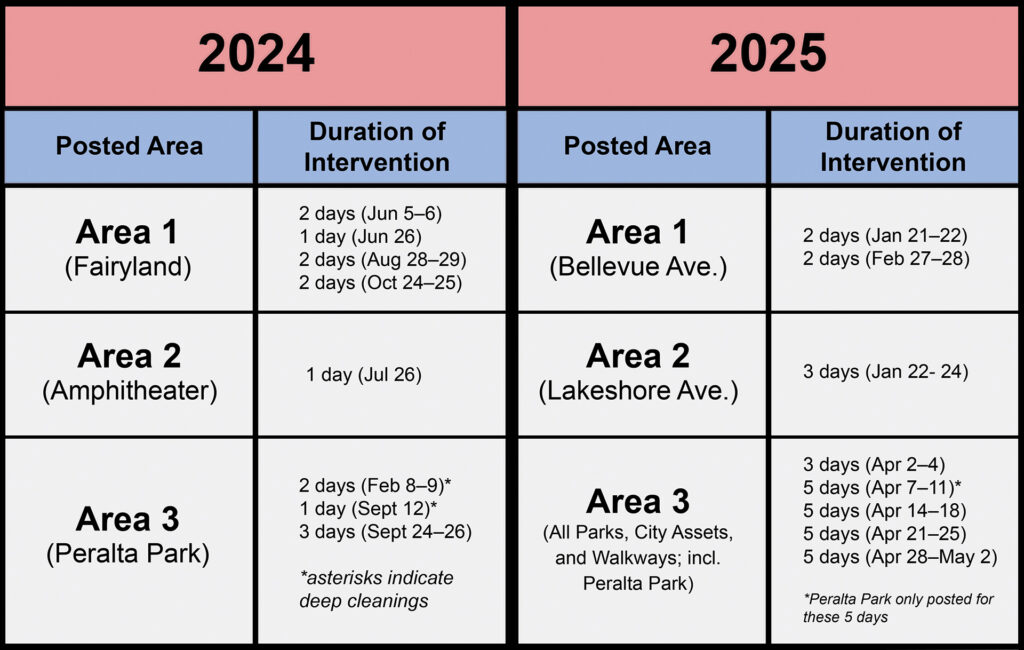
The scale and frequency of the encampment closure notices in April were different from previous years. These clustered operations suggest a systematic change in how interventions are being carried out.
Case study: Expanding noticed areas and sequential operations along the East 12th Street corridor
Notices Adjacent to E 12th Median, May 2025
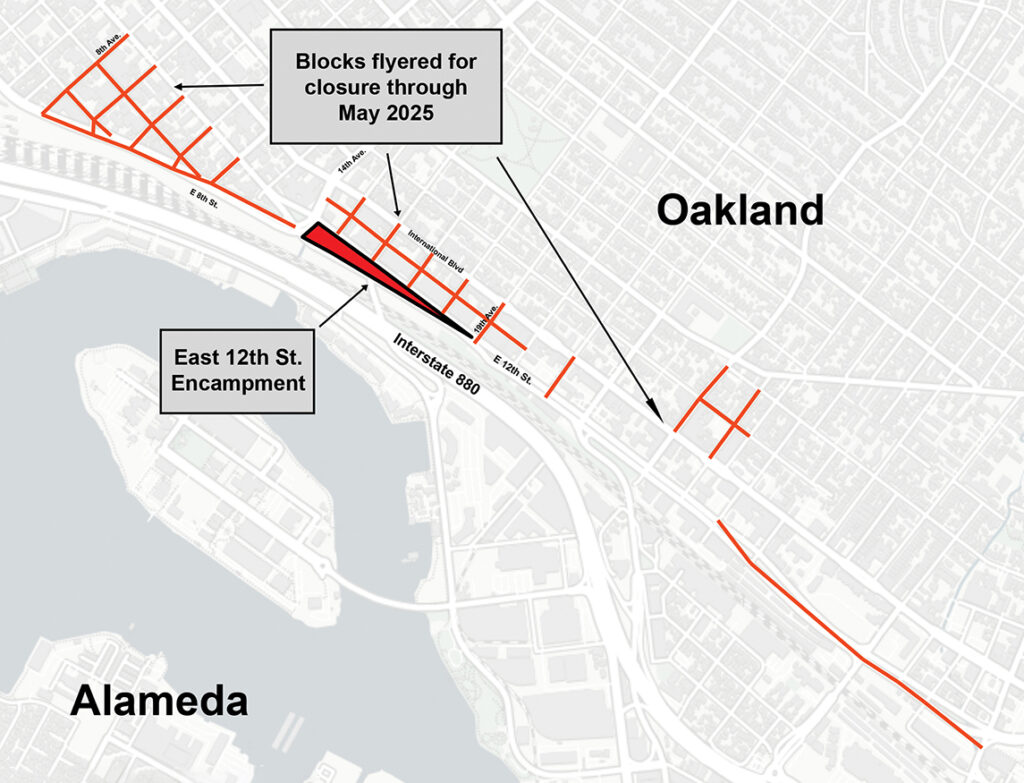
City data suggests that the EMT is not only expanding the spatial reach and duration of encampment interventions, but also posting closure notices on adjacent blocks where people are not actively encamped.
Take the postings along the East 12th Street median, for example. The long-standing encampment in East Oakland stretched for several blocks between 15th and 18th avenues, and has been home to numerous people over the last decade. In spring of 2025, city data showed a marked escalation in the city’s attempts to permanently close the encampment there after the city received state funding to move its residents into a residential hotel.
For four consecutive weeks, new notices that the city would be working to close the encampment went up along the median each Monday, starting on May 12. But unlike in previous years, the notices were also posted at largely uninhabited intersections of the blocks surrounding the main encampment area at the median, and for several blocks in each direction. This marked a departure from prior years, when East 12th Street typically saw sporadic cleanings or Partial Closures focusing on the median itself.
In general, longer-term closure notices posted on adjacent blocks expanded boundaries of the formal closure area, creating heightened uncertainty for residents. When asked how he prepares for an encampment sweep after receiving a closure notice, Oakland encampment resident Aidan Wells once told Street Spirit that “the mental part is my anxiety going through the roof. The mental part is the continuous breakage for me and my peers.”
Because the posted closure zones are spanning wider and wider areas like here on East 12th Street, residents must move farther away from the site of their original encampment. Advocates say this makes it harder for outreach workers and service providers to provide support to encampment residents they have worked with in the past, as it becomes difficult to locate specific individuals and offer continuous care.
Cole Haddock and Maria Toldi are recent graduates of UC Berkeley. They are currently working on an investigative mapping report of encampment sweeps in the Bay Area.